Demographics

The diversity and demographic characteristics of intersex people are not widely understood. This page presents details from an independent sociological survey conducted in Australia in 2015.
About this study
This page presents extracts of demographic material from an independent sociological survey led by Dr Tiffany Jones, then of the University of New England. The study had an external community reference group. One member of the reference group was a director of IHRA. The researcher comments in the Acknowledgements to the research:
This project benefitted from the enthusiasm of my community reference group: Bonnie Hart – President of the Androgen Insensitivity Syndrome Support Group Australia (AISSGA), Morgan Carpenter – Director of Organisation Intersex International Australia (OII Australia), and Gavi Ansara – representing the Australian National LGBTIQ Health Alliance. No funding was accepted from their organisations by the researcher and the group were not involved in conducting or writing up of the research; these individuals (amongst others from different groups) instead gave community insights into the project’s framing of intersex issues, appropriateness of themes and word choices in the development of the questionnaire and strategies in the recruitment processes, and lastly were given an opportunity to comment on completed drafts of report chapters.
- Read more on defining intersex
- Read more on intersex population figures
- Read more about respectful inclusion in research and forms
The study was designed as a survey of people “born with congenital atypical sex characteristics”. This language enabled the survey to ask questions about preferred terminology, without presupposing acceptance of the term intersex. Survey information was distributed widely. There were 272 respondents, making it one of the largest studies of people born with atypical sex characteristics conducted.
While every survey is subject to forms of selection bias, it is the view of IHRA that this survey provided us with useful demographic information on people born with atypical sex characteristics in Australia for the first time.
- Read a more detailed summary of the research on this site.
- Read a presentation on the preliminary demographic and wellbeing data, presented at the AIS Support Group Australia conference in 2015.
- Peer-reviewed papers detailing the full methodology and further results were first published from February 2016. Links to these papers are given at the end of this page.
Sex assignments and gender identities

The gender of survey respondents
At the time of the survey: 52% of respondents indicated that they were female, 23% indicated that they were male, and 25% selected a variety of other options. Multiple choices were possible.
It is clear that one single legal sex classification is not appropriate for all intersex people. It is also clear that we are more likely to reject the sex of rearing or be gender fluid than the general population. One quarter of respondents had sex markers or gender identities other than female or male. Conversely, 75% are female or male, and these classifications or identifications also need respect.
Sexual orientation
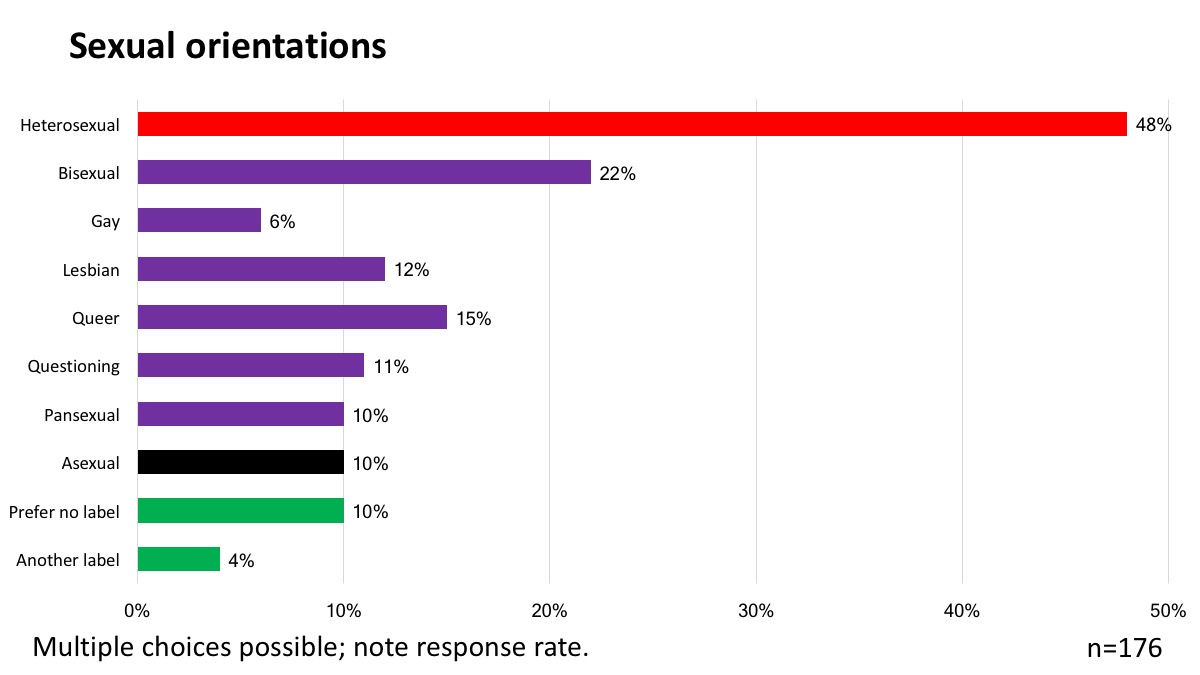
Sexual orientations
48% of respondents stated that they were heterosexual, while 22% selected bisexual, 15% queer. 10% of individuals stated asexual, while the same percentage “prefer no label” and 4% prefer “another label”. Multiple choices were possible.
The data shows that people born with atypical sex characteristics are more likely to be non-heterosexual than the general population, and we may also be more likely to be asexual.
Additionally, there is a clear need to recognise that many intersex people are heterosexual. As with transgender populations, this means that many “LGBTI” people are heterosexual.
Sex characteristics
Respondents had more than 35 different variations, including 5-alpha-reductase deficiency, complete and partial androgen insensitivity syndrome (AIS), bladder exstrophy, clitoromegaly, congenital adrenal hyperplasia (CAH), cryptorchidism, De la Chapelle (XX Male) syndrome, epispadias, Fraser syndrome, gonadal dysgenesis, hyperandrogenism, hypospadias, Kallmann syndrome, Klinefelter syndrome/XXY, leydig cell hypoplasia, Mayer- Rokitansky-Küster-Hauser syndrome (MRKH, mullerian agenesis, vaginal agenesis), micropenis, mosaicism involving sex chromosomes, mullerian (duct) aplasia, ovo-testes, progestin induced virilisation, Swyer syndrome, Turner’s syndrome/X0 (TS), Triple-X syndrome (XXX).
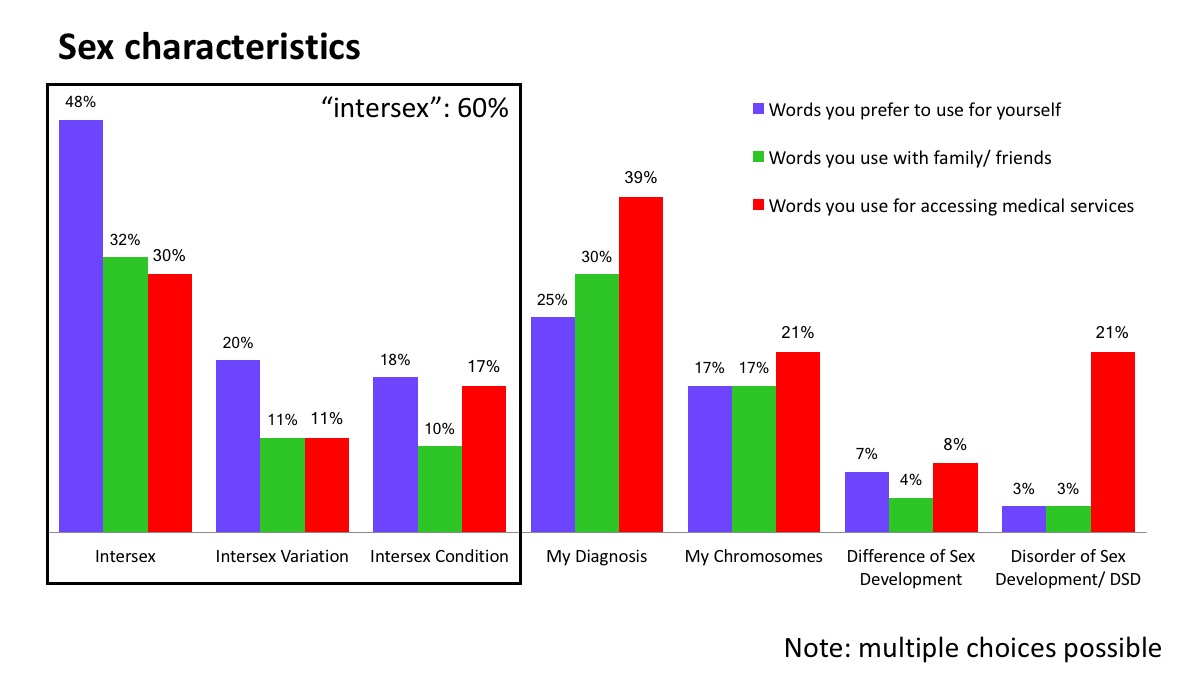
Sex characteristics
The words people use to describe our bodies and sex characteristics vary significantly. Overall, 60% of respondents use words including the term intersex; a proportion describe as “having an intersex variation” or “having an intersex condition”. The use of diagnostic labels and sex chromosomes is also common.
As is the case for all stigmatised minority populations, language choices vary from person to person, and depending on where used. It is particularly notable that only 3% of respondents use the clinical term “disorders of sex development” to describe themselves, while 21% use that term when accessing medical services. From our perspective, this shows a perceived need to disorder ourselves to obtain appropriate medical care.
Educational attainment
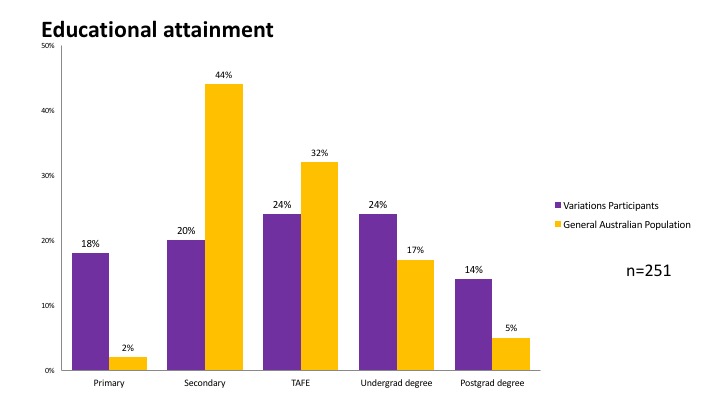
Educational attainment
While 2% of the Australian population fail to complete secondary school, that was true of 18% of the survey population. This appears to be due to bullying on the basis of physical characteristics, and the impact of coercive “normalising” medical interventions during puberty. Conversely, those respondents that completed secondary school are better qualified than the general population, particularly at postgraduate level.
Income
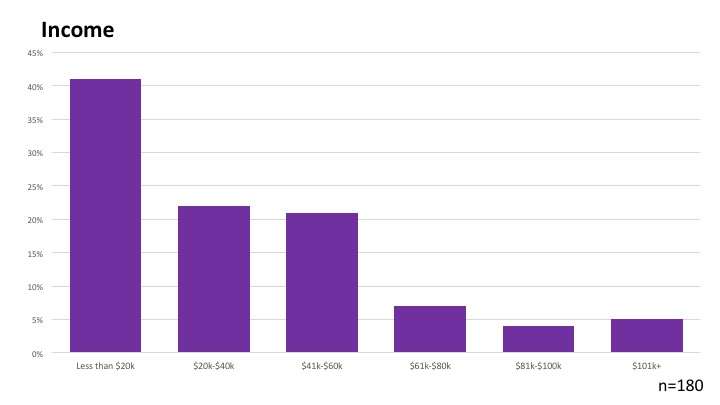
Income levels
41% of respondents were in the lowest income bracket, earning less than $20,000 per year, and 63% earn under $41,000 per year. For comparison purposes, the ABS report that the median full time income at the time of the survey was $80,000 and the figure for “All employees average income” was just under 60,000 ($59,576).
Medical interventions and health
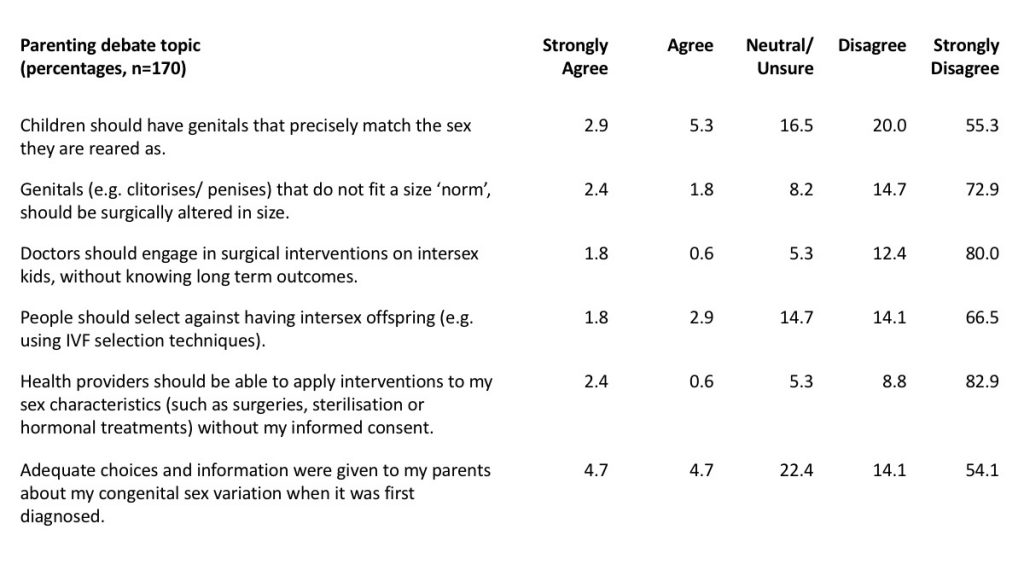
Responses to questions about medical practices, particularly those of early childhood.
The study researcher found “strong evidence suggesting a pattern of institutionalised shaming and coercive treatment”.
60% received treatments on basis of sex characteristics, half at under 18 years of age.
The majority experienced at least one negative impact from treatment.
44% reported institutional pressure to ensure correctly gendered behaviour; 43% reported this from parents.
60% had thought about suicide, 19% had attempted it (the Australian average is less than 3%).
Respondents broadly rejected standard medical practices on children with intersex variations.
Marital status
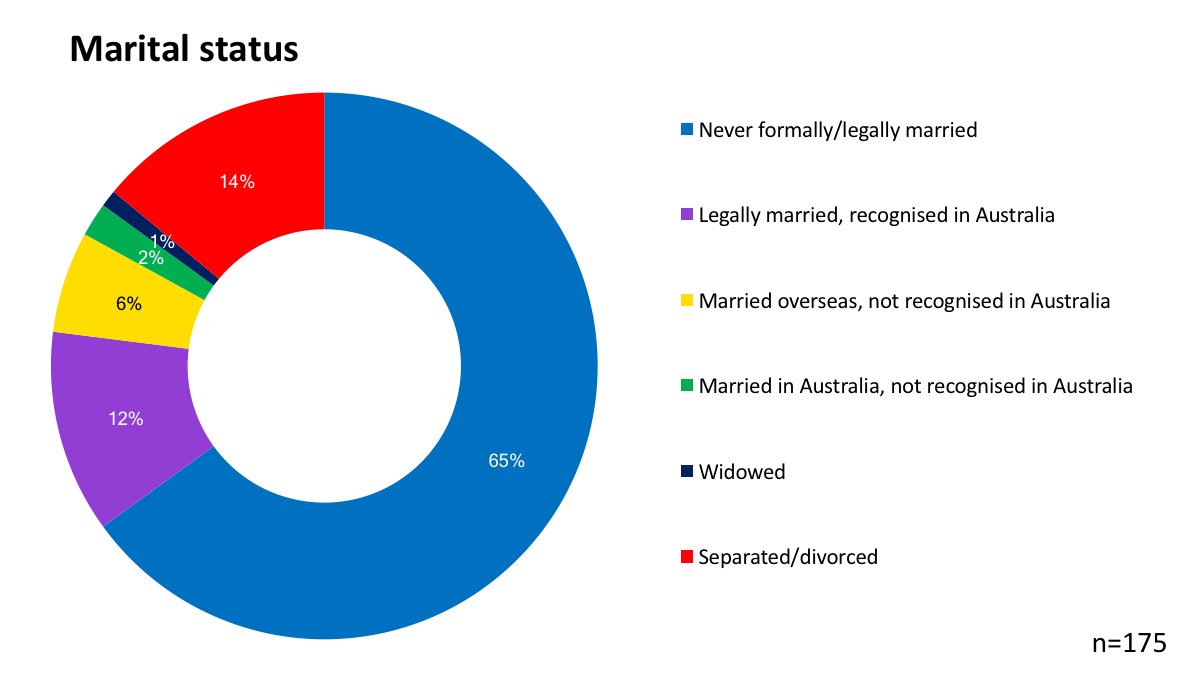
Marital status
65% of respondents who answered a question on marriage and relationships had never legally or formally married. 12% of respondents are legally recognised as married in Australia. 8% of people had married overseas (6%) or in Australia (2%) but their marriage is not recognised here. 1% were widowed, and 14% are separated or divorced.
Overall, 62% of respondents were in a relationship or dating. 65% of participants in the survey said that “their variation (or related treatments) impacted on their sexual activities”.
Aboriginal and Torres Strait Islander descent
4% of participants in the survey were of Aboriginal and Torres Strait Islander descent. There were no distinct trends differentiating these respondents from other survey respondents.
More information
More summary information from the research by Jones is available on this site.
Read a presentation on the preliminary demographic and wellbeing data, presented at the AIS Support Group Australia conference in 2015.
The following papers outline the research methodology and present further information on many of the statistics on this page:
Jones T. The needs of students with intersex variations. Sex Education. 2016 Mar 11;16(6):602–18. Available from: http://www.tandfonline.com/doi/full/10.1080/14681811.2016.1149808
Jones T. Intersex and Families: Supporting Family Members With Intersex Variations. Journal of Family Strengths. 2017 Sep 7;17(2). Available from: http://digitalcommons.library.tmc.edu/jfs/vol17/iss2/8
You must be logged in to post a comment.